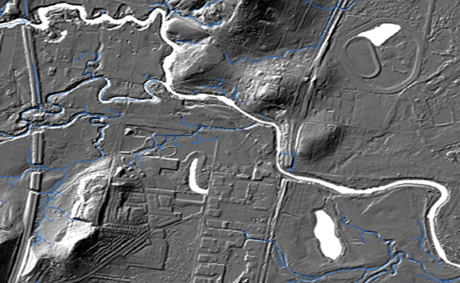
Urban Digital Elevation Model for sea-level rise planning
Sea-Level Rise Maps
A series of static sea-level rise maps has been developed that highlight areas of Australia’s coast which are vulnerable to a low, medium and high sea-level rise scenario relevant to 2100. These maps allow community members to identify low lying areas vulnerable to inundation from any number of sea level scenarios. The indundation maps show the potential long-term effects of climate change, highlighting three simple sea level rise scenarios for 2100: low (0.5m), medium (0.8m) and high (1.1m). The maps are available online via the OzCoasts website hosted by Geoscience Australia.
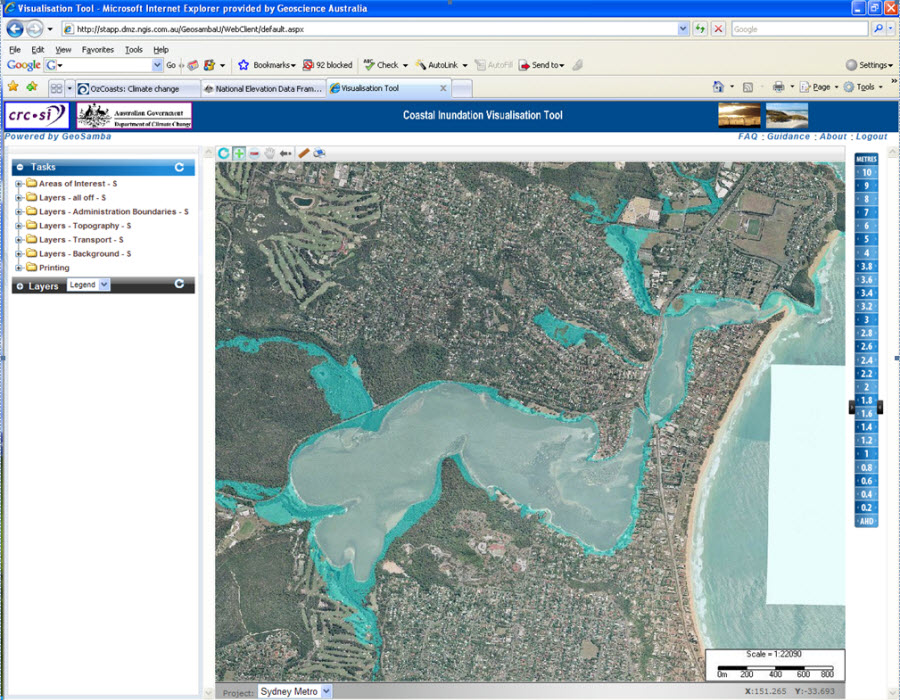
Visualisation Tool
This is an interactive, web-based tool that displays potential inundation from sea level rise. This tool allows government agencies to identify low lying areas vulnerable to inundation from three sea level scenarios. The tool responds to a call from decision-makers for better information to understand the risks from climate change.
Elevation Data Web Portal
A web portal for government and researchers to access elevation data for research and risk assessment modelling. In the longer term it will become a ‘virtual repository’ for elevation data across Australia. The portal is hosted by Geoscience Australia.
The Urban DEM project has completed phase one. Phase two is underway, with the objectives of acquiring high resolution DEM data for much of coastal Australia in conjunction with the states. Research projects to synthesise terrestrial data with bathymetric data to produce nested and continuous DEM/bathymetry data for sea level rise and inundation modeling are being scoped.